How to Measure Alt Text Quality Across Your Whole WordPress Site
A single image's alt text score doesn't tell you much on its own. Here's how to measure alt text quality as a site-wide metric you can track over time.
Checking one image's alt text tells you about one image. It doesn't tell you whether your site has a systemic problem or a handful of stragglers. That distinction matters, because the fix for each is completely different — and you can only tell them apart by measuring at the site level, not the image level.
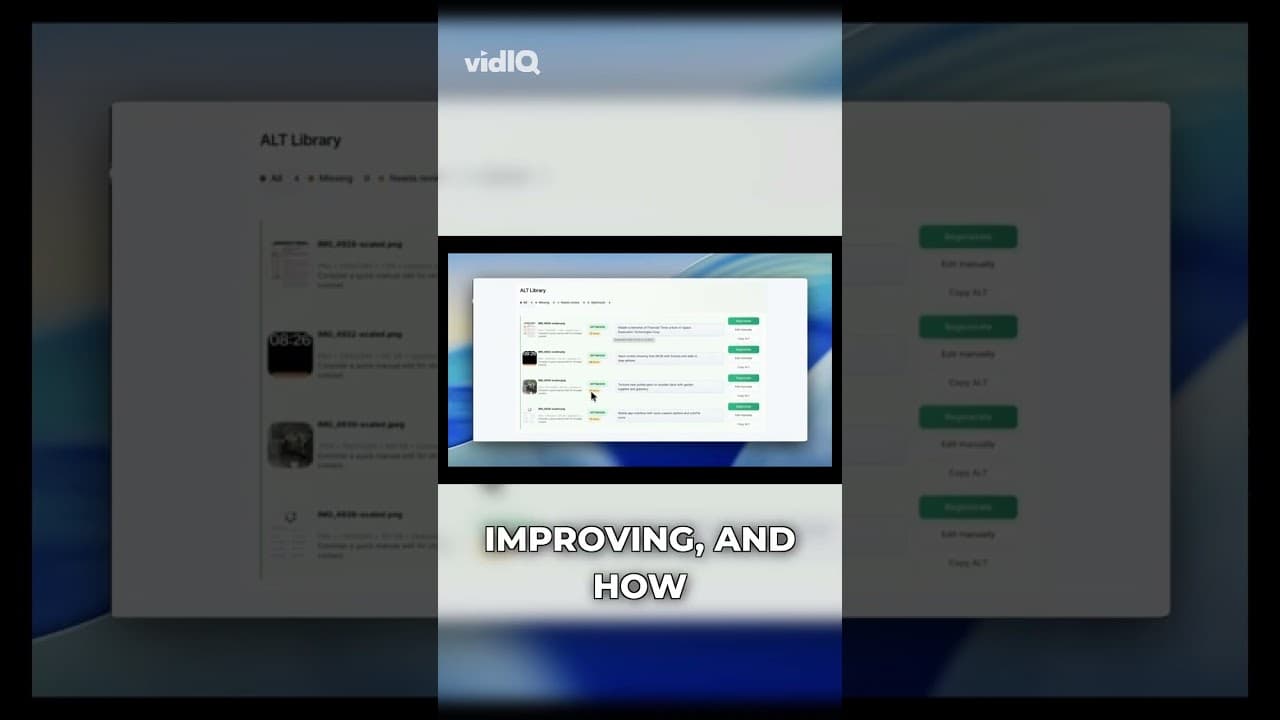
Here's a short video on treating alt text quality as a metric for the whole site rather than a per-image checkbox.
Why "I checked a few images" isn't a real answer
If someone asks how good your site's alt text is, "I looked at a few and they seemed fine" isn't a measurement — it's a sample size of a handful out of what might be thousands of images. Sites accumulate images from years of different contributors, themes, plugins, and import processes, and quality is rarely uniform across all of that. A spot check tells you about the pages you happened to look at, which are usually the ones you already care about and therefore already keep tidy.
The images you haven't looked at — old product listings, a migrated blog archive, images added by a plugin that manages its own uploads — are exactly where the real gaps tend to hide, because nobody's spot check ever lands there by chance.
What a site-wide quality metric actually looks like
A useful site-wide number isn't a single score — it's a distribution across a few buckets that together account for every image in your library:
Missing — no alt text at all. Weak — something's there, but it's a filename, a single generic word, or keyword-stuffed text. Optimised — specific, accurate, natural-language descriptions.
Reporting these three as percentages of your total image count gives you something you can actually track and compare over time, unlike a vague sense that "alt text is mostly fine." A site sitting at 60% optimised, 25% weak, 15% missing has a clearly different problem than one sitting at 90% optimised, 5% weak, 5% missing — even though both might "look fine" if you only spot-checked a few pages.
Turning the metric into a benchmark you track
- Get your starting distribution. Run a full scan of your media library and record the missing/weak/optimised split as percentages, not just raw counts, so the number stays meaningful as your library grows.
- Set a realistic target, not a perfect one. 100% optimised is rarely worth chasing to the last percent — a handful of edge cases (icons, decorative graphics correctly left empty) will always sit outside the "optimised" bucket. Aim for a target like 85%+ optimised on content images.
- Re-measure on a schedule, not just after a cleanup. Monthly or quarterly, depending on how fast your site adds new images. The point is catching drift, not just confirming a one-time fix worked.
- Segment by content type if your site is large. A single sitewide number can hide the fact that your blog images are in great shape while your product catalogue is a mess, or vice versa. Splitting the metric by section tells you where to focus next.
- Watch the trend line, not just the snapshot. A single measurement tells you where you stand. Three measurements over three months tell you whether you're actually improving or just maintaining.
Getting a number without building a spreadsheet by hand
Manually tallying missing/weak/optimised across a media library with thousands of images isn't a realistic way to produce this metric — by the time you finished counting, new uploads would already have changed the answer. The OpptiAI Alt Text plugin keeps this distribution live for your WordPress media library, so the site-wide number is something you check rather than something you calculate. For an independent read on what's actually rendering on your public pages, a free image SEO audit gives you a comparable snapshot from outside the WordPress admin.
Frequently asked questions
What's a good target percentage for optimised alt text on a WordPress site?
Aim for roughly 85% or higher of content images in the "optimised" bucket, with the remainder split between correctly-empty decorative images and a small tail of edge cases. Chasing literally 100% often means fighting classification issues on ambiguous images rather than fixing real gaps — diminishing returns set in well before you hit the top.
How is a site-wide alt text quality metric different from a single page's SEO score?
A page-level SEO score typically weighs many factors at once — headings, word count, internal links, alt text among them — for one page. A site-wide alt text metric isolates just this one factor and measures it across your entire media library, which is what tells you whether missing or weak alt text is a widespread pattern versus an issue confined to a few pages. You need both views: the page score for individual page health, the site-wide metric for the scale of the alt text problem specifically.
How often should I re-measure alt text quality across my WordPress site?
Monthly if you publish frequently or run an active WooCommerce store with regular new products; quarterly is usually enough for a slower-moving site. The right cadence depends on how quickly new, unfixed images accumulate — measure often enough that the trend line has more than one or two points to show real movement.
Related Posts
Catch New Uploads Before Alt Text Debt Comes Back
Autopilot and cleanups still miss images. Here's the routine check that catches new uploads slipping through before missing alt text piles up again.
Set Up Autopilot Alt Text for New WordPress Uploads
Manually writing alt text for every new upload doesn't survive contact with a busy site. Here's how to configure autopilot rules that generate it for you.
Bulk-Edit Alt Text From a Filtered List, Not the Media Library
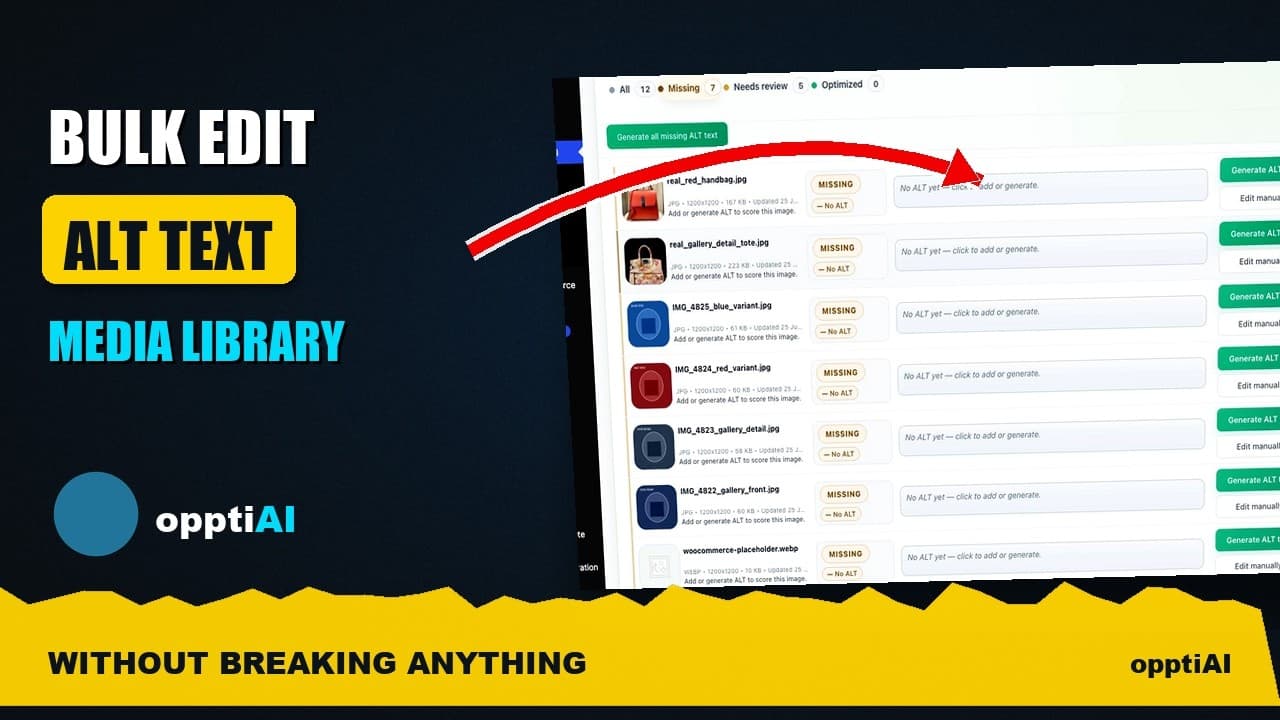
Opening one attachment at a time to fix alt text doesn't scale. Here's how to bulk-edit from a filtered list instead, without breaking anything.