What we did
- Ran free public-page audits on top category and product URLs to size the visible gap.
- Scoped “in-scope” images: featured + gallery on active SKUs; left decorative badges empty.
- Bulk-generated drafts in batches; humans edited materials, colours, and model names.
- Re-checked a public sample and kept new uploads in the same review loop.
- Compared Search Console Images clicks for weeks 5–8 against the prior four-week baseline.
Store snapshot
Think of a mid-size fashion and home goods store on WooCommerce: a few thousand active SKUs, heavy reliance on product photography, and a marketing team that already invested in title tags and content — but treated image alt text as “something we’ll get to later.”
Like many catalogues, the library had grown through CSV imports, theme demos, and seasonal photoshoots. Featured images often carried filename-style alt or nothing at all. Gallery images were almost entirely empty. Screen-reader users hit dead ends on product pages, and Google Images had little trustworthy text to associate with the photos.
- Roughly 3,800 active product SKUs in scope
- ~6,500 featured + gallery images counted as in-scope
- UK-focused traffic; English product copy already solid
- No dedicated accessibility retainer before this project
The problem we could prove
The team’s brief was not “rank #1 for every product photo.” It was simpler: close the obvious alt gap on money pages, stop the backlog from growing, and see whether cleaner image SEO correlated with more discovery in Google Images.
We started with evidence anyone can gather without installing a plugin: free public-page audits on the homepage, two category hubs, and five bestselling product URLs. The pattern was consistent — informative product shots with missing or filename alt, decorative badges sometimes incorrectly filled, and gallery images ignored entirely.
We treated “useful alt” as human-readable, specific enough to identify the product shot, and empty only when the image was decorative. Filename strings and keyword stuffing counted as failures.
Approach: audit → scope → remediate → measure
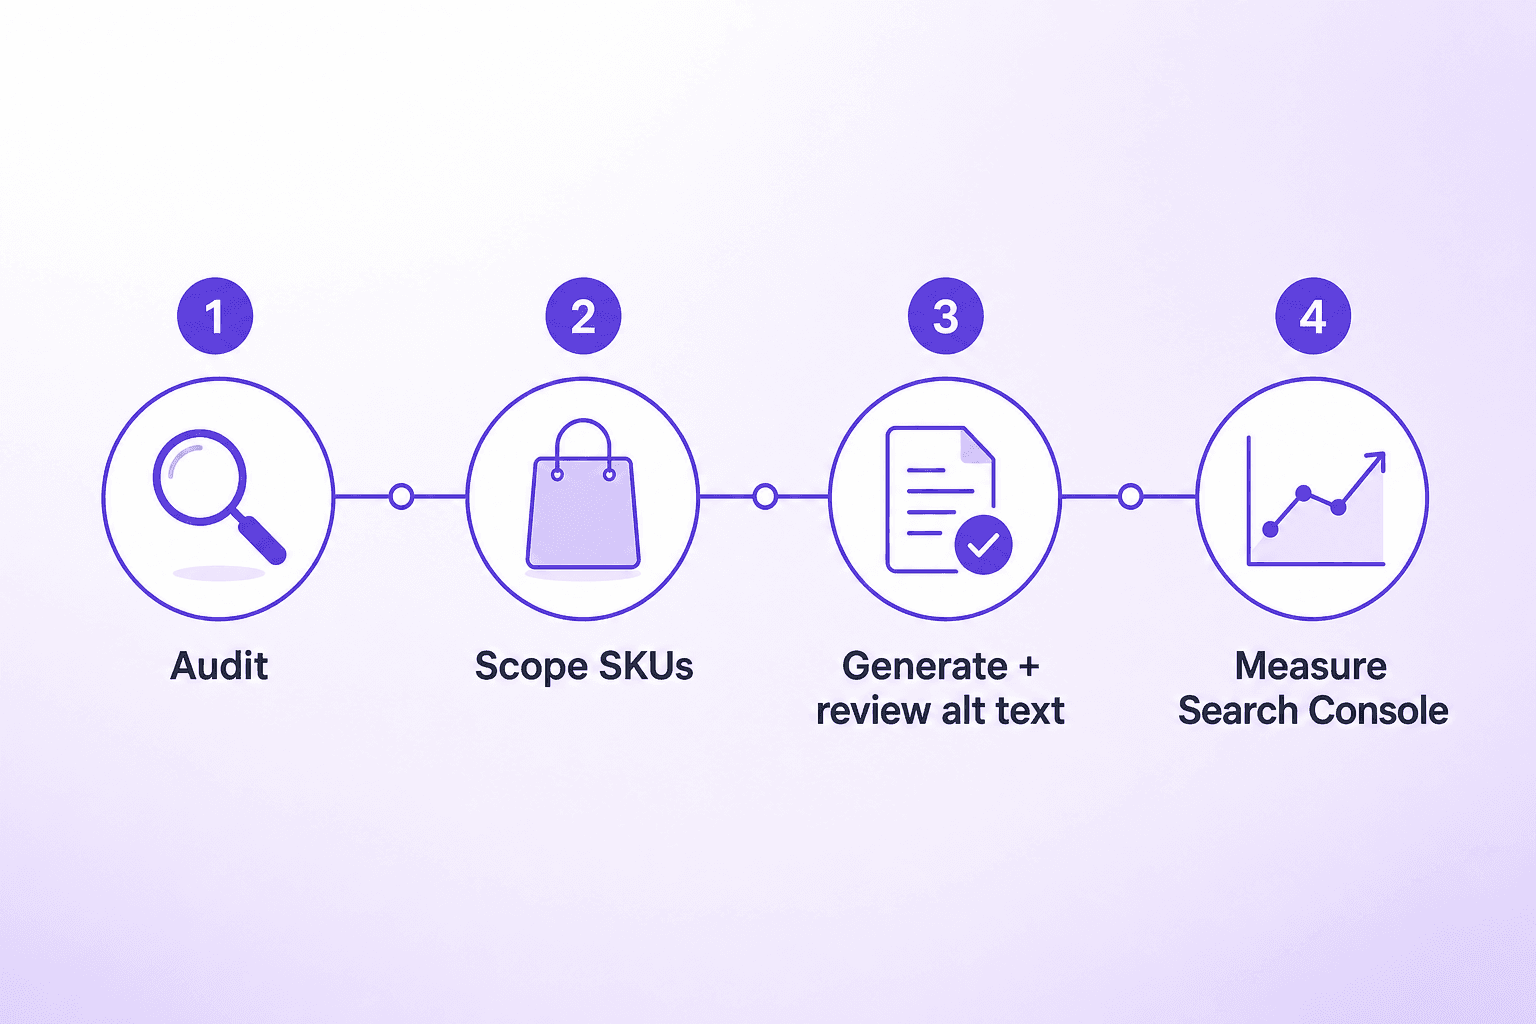
The playbook followed four phases over eight calendar weeks. Weeks 1–2 were diagnosis and scoping. Weeks 3–6 were batch remediation with review. Weeks 7–8 were hold-out measurement while new uploads stayed in the same loop.
- Week 1: Public audits + Media Library sample; define decorative policy
- Week 2: Prioritise Tier A (bestsellers + category heroes) vs long-tail
- Weeks 3–6: Bulk generate in batches of a few hundred; edit before save
- Weeks 7–8: Re-audit public samples; lock new-upload automation with review
What the remediation looked like day to day
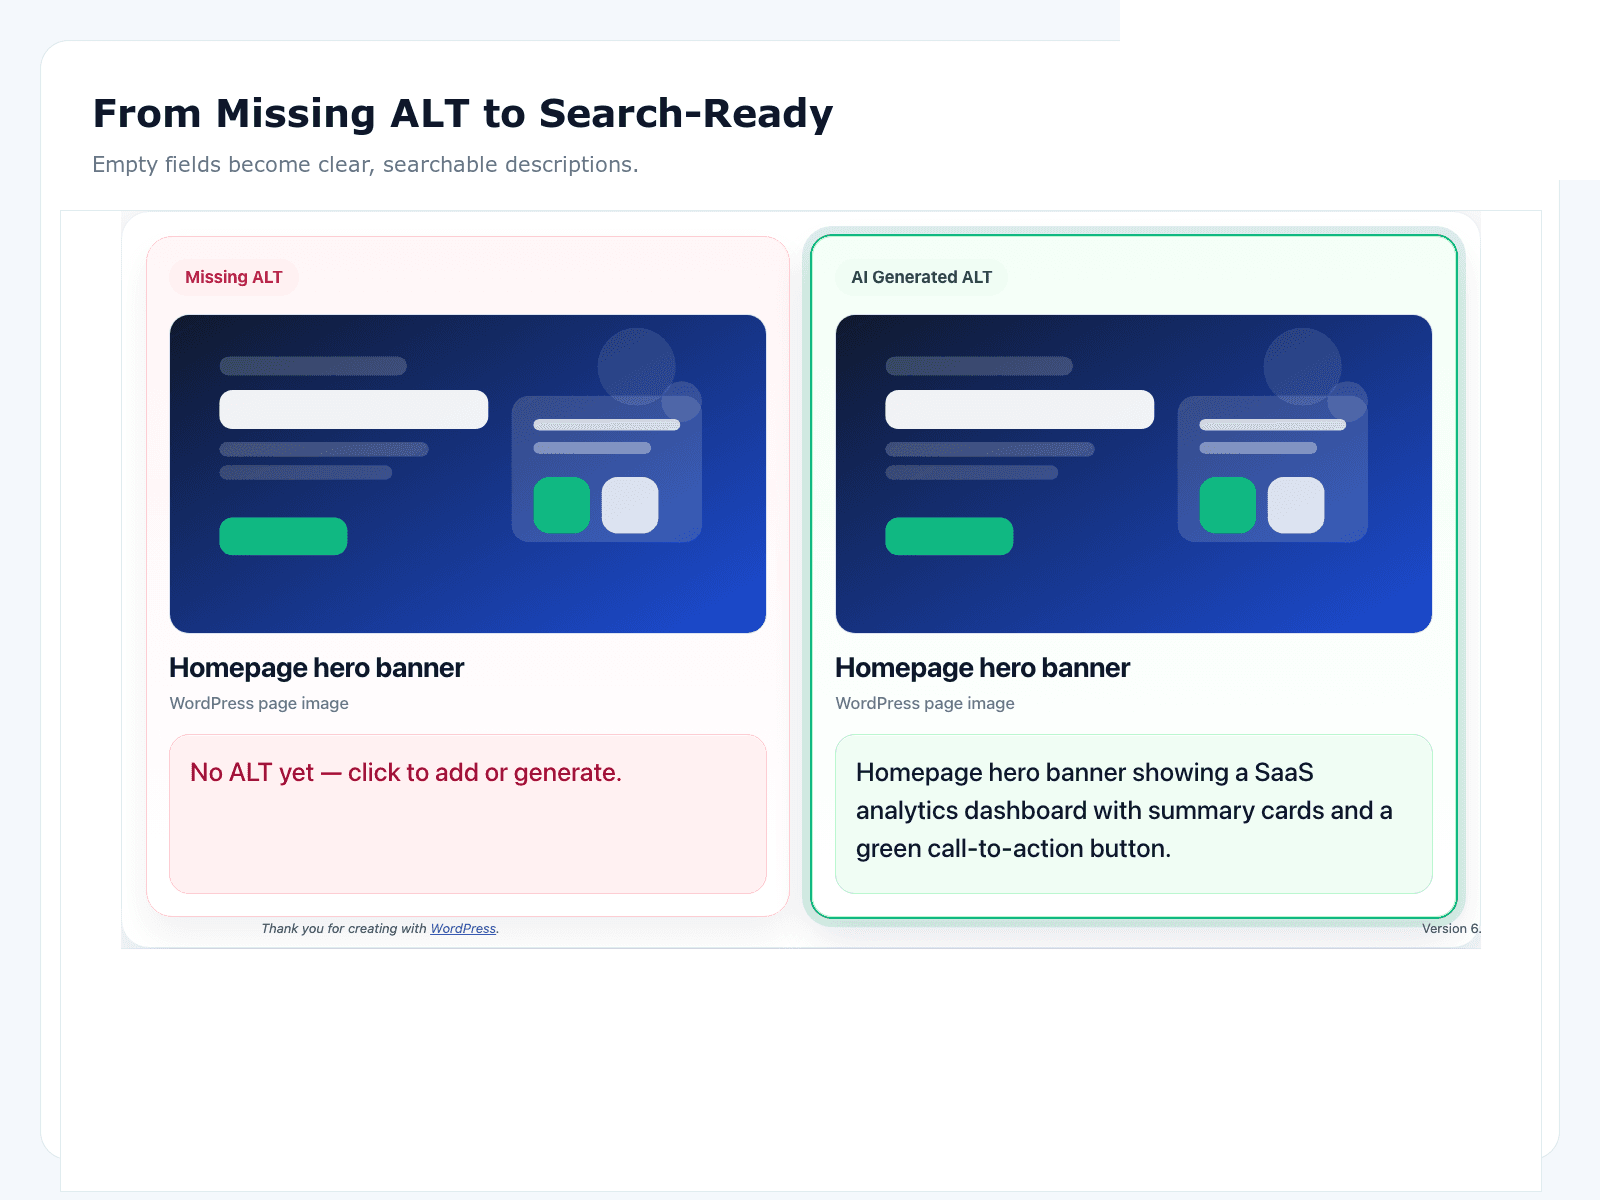
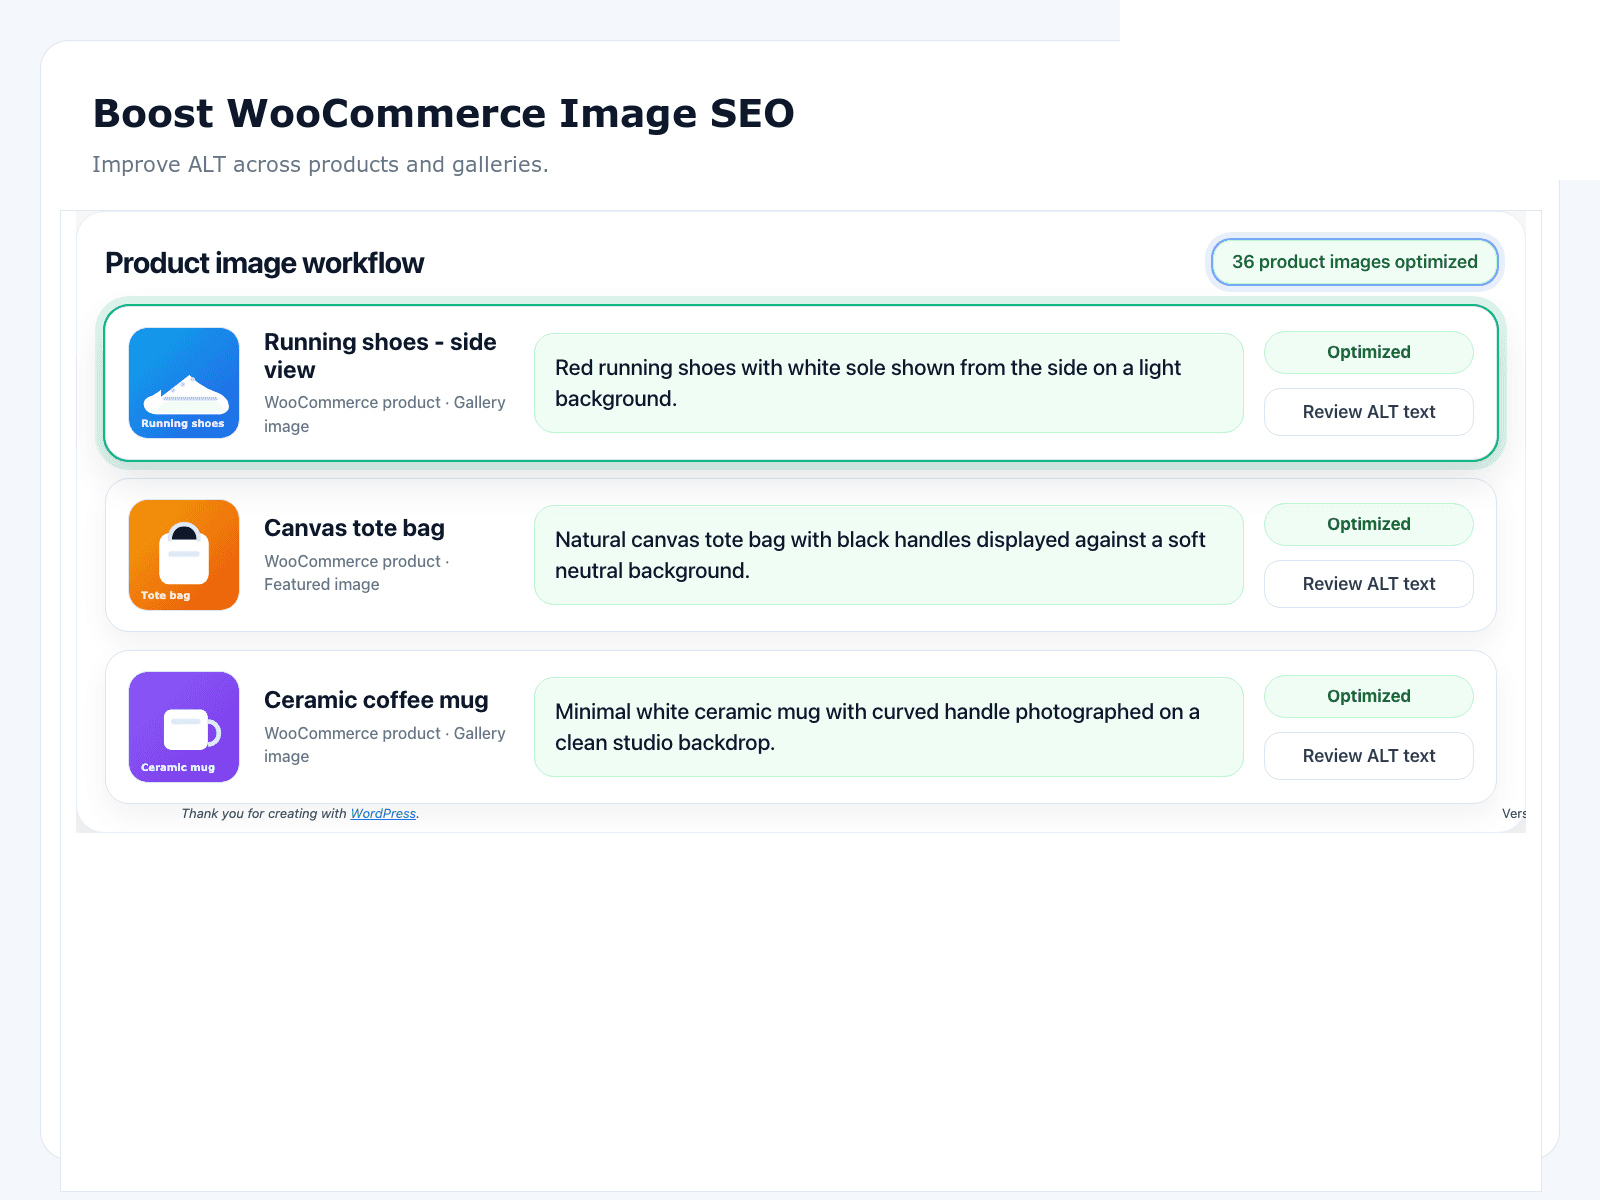
Operators worked in wp-admin with OpptiAI Alt Text: scan for empty/weak alt, generate drafts that could see the product image plus product context, then edit materials, colourways, and pack sizes before saving. Gallery images were included for active SKUs because shoppers and crawlers both see them.
Decorative overlays (sale bursts, trust badges) were left empty on purpose. That single policy decision prevented a wave of “red SALE badge” alt strings that would have looked busy without helping users or image search.
- Batch size: ~250–400 images so QA stayed fresh
- Edit rate: roughly one in three drafts needed a material fix
- House style: front-load the product type, then one distinguishing detail
- CSV imports: mapped alt fields so seasonal drops did not reopen the gap
Results: coverage first, then a ~20% Images uptake
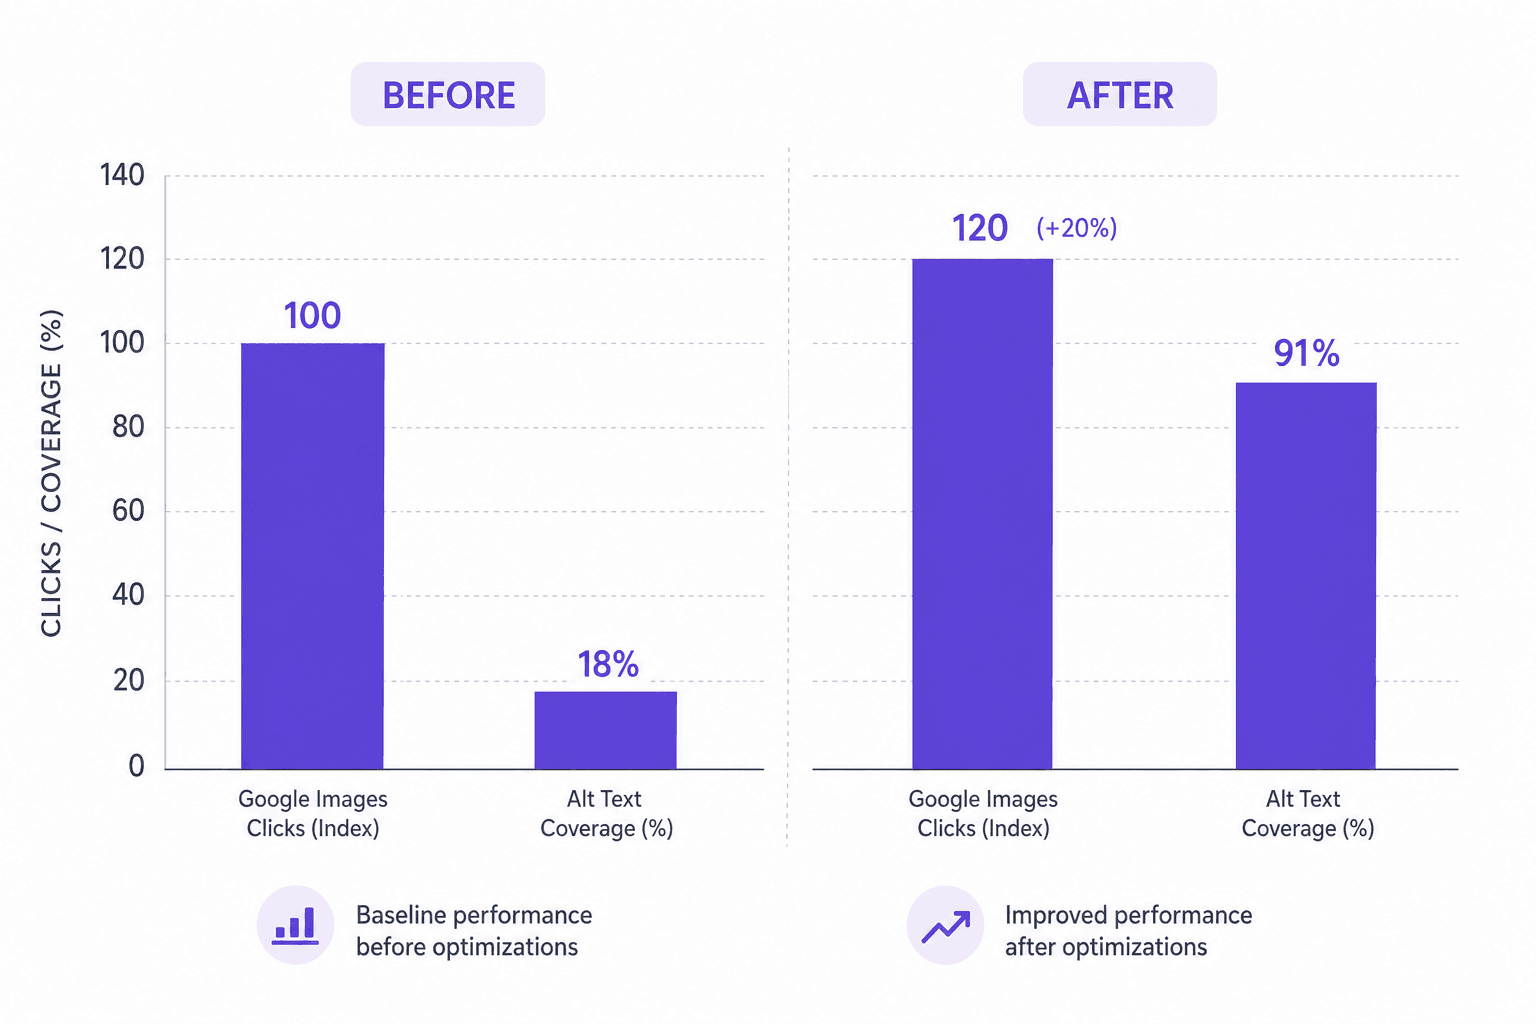
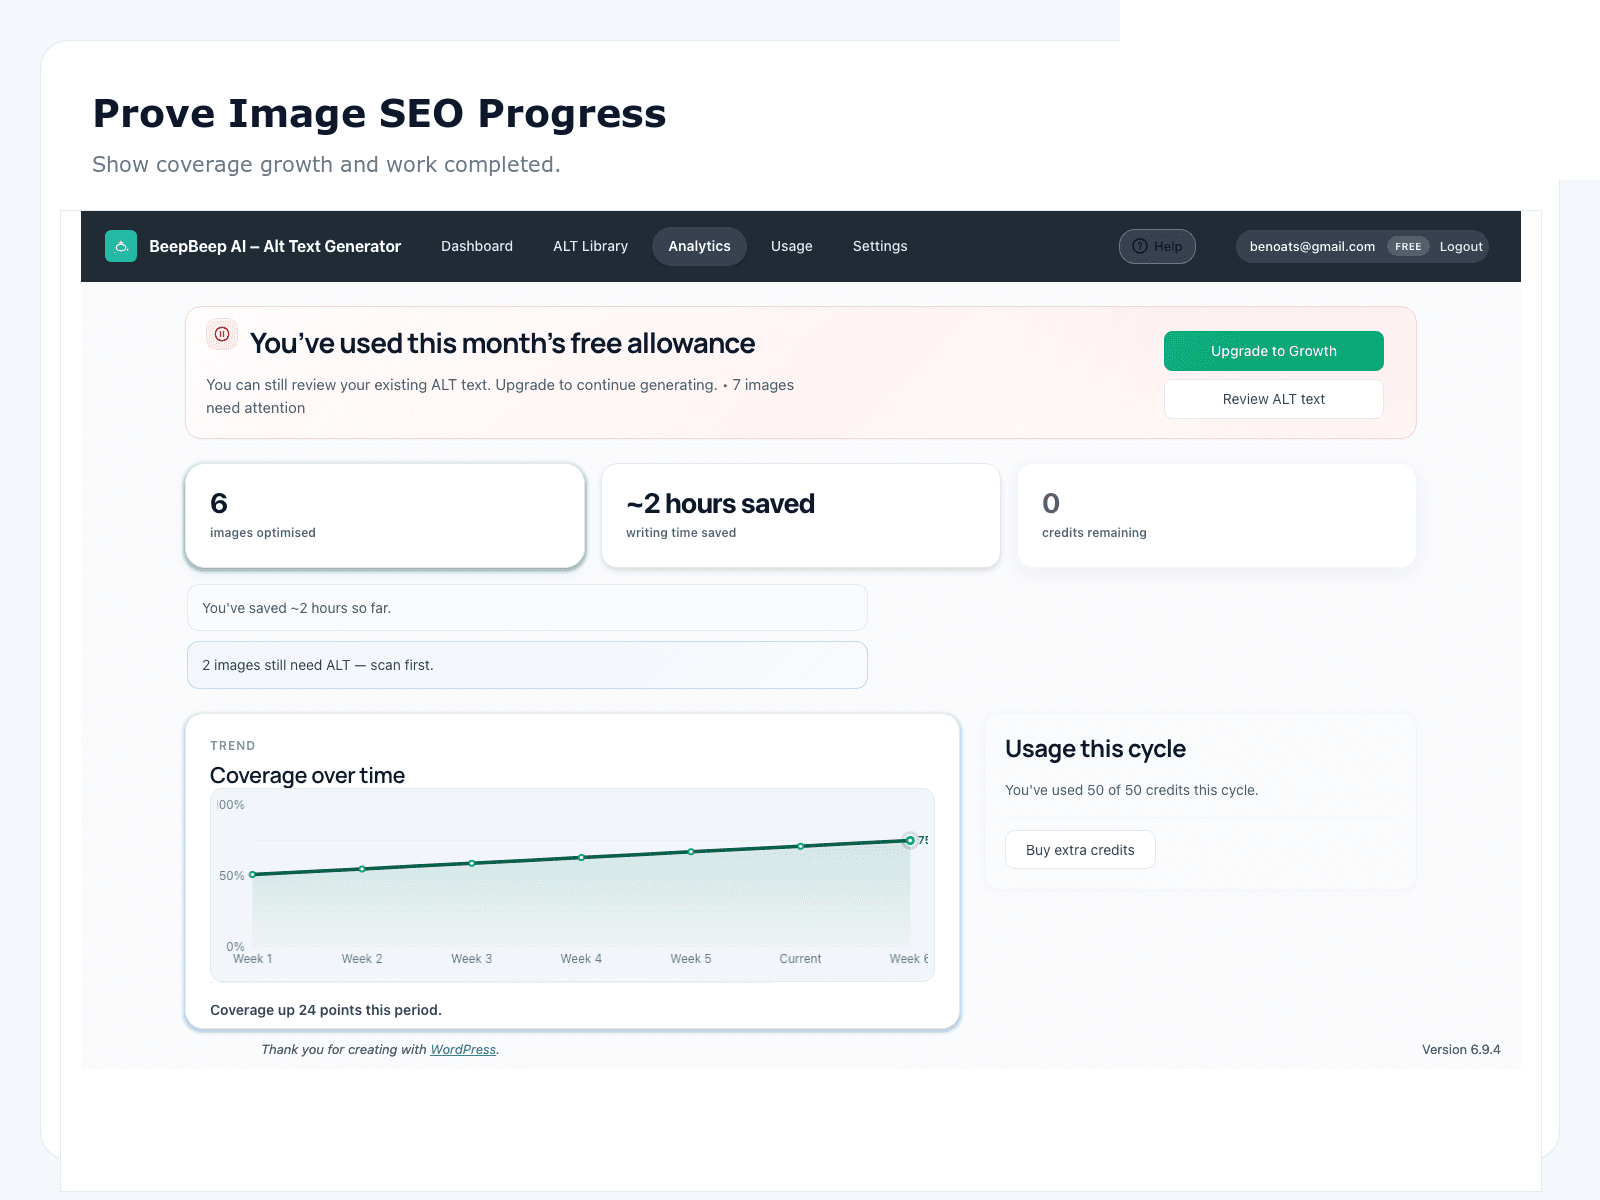
Coverage moved first. In-scope featured and gallery images with reviewed, useful alt went from about 18% to about 91% by the end of week 6. The remaining gap was mostly discontinued SKUs and a few template edge cases parked for a later pass.
Search Console’s Images report was the secondary scoreboard. We indexed the prior four-week click total to 100, then compared weeks 5–8 after the bulk of Tier A and Tier B products had been remediated. Clicks landed around index 120 — roughly a 20% uptake.
Impressions also rose, but more noisily week to week. We report clicks as the headline because they are less sensitive to ranking-position jitter in a short window. Organic web sessions from Images remained a minority of total traffic — useful discovery, not a storefront replacement.
A 20% Images click uplift is a measured correlation in this composite window — not proof that alt text alone “caused” every click, and not a guarantee for every niche or seasonality pattern.
What did not magically happen
Revenue did not jump 20% because Images clicks rose 20%. Most buyers still entered through brand, paid, and classic organic web results. Accessibility improved for screen-reader users on product templates, which mattered independently of SEO.
We also did not claim position-one screenshots for every SKU. Image search is competitive and visual; alt text is one signal among many (file quality, page relevance, inbound links, shopping feeds). The honest win was cleaner coverage plus a directional Images uplift worth keeping the workflow funded.
- No invented “£X revenue attributed to alt text” claim
- No fake client logo wall
- No promise that decorative images need keyword-rich alt
- No “set and forget” — new uploads still need the review gate
Reuse this playbook on your catalogue
If you run WooCommerce, you can mirror the sequence without copying our composite numbers. Start with a free public audit on a handful of money URLs, decide what is in scope, remediate in reviewed batches, then compare a short Search Console Images window after the work lands.
- Prove the gap on live URLs before buying tooling
- Prioritise bestsellers and category heroes before the long tail
- Review AI drafts — especially brand, material, and variant names
- Measure Images clicks with a defined before/after window
- Keep new uploads on the same generate → review → save loop
Takeaways
- Coverage is the leading indicator; Images clicks are a lagging one.
- A ~20% Images click uptake is plausible after serious product-image remediation — treat it as directional, not destiny.
- Human review before save is what keeps AI fast without making the catalogue look spammy.
- Decorative policy and CSV import hygiene matter as much as the first bulk pass.
FAQ
Is the 20% figure guaranteed for every ecommerce store?
No. It is an illustrative composite outcome for a mid-size WooCommerce catalogue after raising useful alt coverage into the 90%+ range. Seasonality, niche competition, and photo quality all change results.
Did you count impressions or clicks?
The headline +20% uses Google Search Console Images clicks, indexed against a four-week pre-remediation baseline. Impressions also moved, but clicks were the cleaner short-window metric.
Was this a named OpptiAI customer?
No. OpptiAI publishes anonymised composites so we can teach the workflow without inventing brand testimonials or unverifiable ROI claims. See the disclaimer at the top of this page.
What tooling did the workflow use?
Free public-page audits for proof, OpptiAI Alt Text in WordPress for scan → generate → review → save, and Google Search Console for Images measurement.